It fixes what it can prove, and asks about the rest.
An incident-response agent for Kubernetes. It investigates on its own, acts only inside limits you set explicitly, and hands the incident to a human the moment it cannot show its work.
What stops it → See it runningWhat stops it
Every one of these is on by default, and every one of them is a separate deliberate change to switch off. A fresh install does nothing at all until four of them are changed, in git, by a person.
It ships in observe mode
The default is mode: Observe. It watches, investigates and writes
findings, and executes nothing. Acting is not a setting you forget to turn off; it
is one you have to turn on.
The namespace allowlist is empty
policy.actionableNamespaces: []. It cannot touch a namespace nobody
named. Protected namespaces stay refused even when they are listed.
Autonomy is granted per action type, never globally
policy.autoEnabledActionTypes: []. Restarting a pod and scaling a
workload are separate grants. There is no switch that enables all of them.
The model never holds a tool that changes anything
Diagnosis is one model call with read-only tools; planning is a second with no tools at all and a JSON schema. Execution is ordinary C# over a closed list of action types. The model proposes; compiled code disposes.
Everything it does is verified, then reverted if it did not work
Each action is checked at 60 seconds, 5 minutes and 15 minutes against a deterministic predicate. If the workload is not better, it rolls the change back and escalates rather than declaring success.
No audit, no action
The audit trail is append-only at the database role level — the application role
is denied UPDATE and DELETE. If it cannot write the
record, it refuses to act.
There is a kill switch, and a latch behind it
A ConfigMap arm, an environment arm and a database arm; the most restrictive wins. A runaway backstop latches on its own and will not clear until a human clears it.
And then, what it does
An alert arrives from Alertmanager. Everything below happens without anybody opening a terminal.
Investigate
Reads metrics, logs, traces and Kubernetes objects, and writes a hypothesis with the evidence it rests on — quoted, and linked back to the step that produced it.
Decide
Eleven policy gates run before anything is proposed. Each denial records a reason code, so "why didn't it act" is answerable from a metric.
Act, or ask
Inside its grant it acts and verifies. Outside it, it asks — a card with a link, and an approval that has to say who authorised it.
Tell someone
Escalation is written to a Postgres outbox in the same transaction as the state change that caused it, so a pod restart cannot lose it.
Install
A Helm chart and a multi-arch image, both on GHCR, both with build provenance attested. It will do nothing until you tell it otherwise.
# installs in observe mode, acting nowhere
helm install hephaisto oci://ghcr.io/truerelevance/charts/hephaisto \
  --namespace hephaisto --create-namespace
The console is on port 8080. Point it at Prometheus, Loki and Alertmanager, and it will start opening incidents it has no permission to do anything about — which is the right way round to start.
Or look first, without a cluster
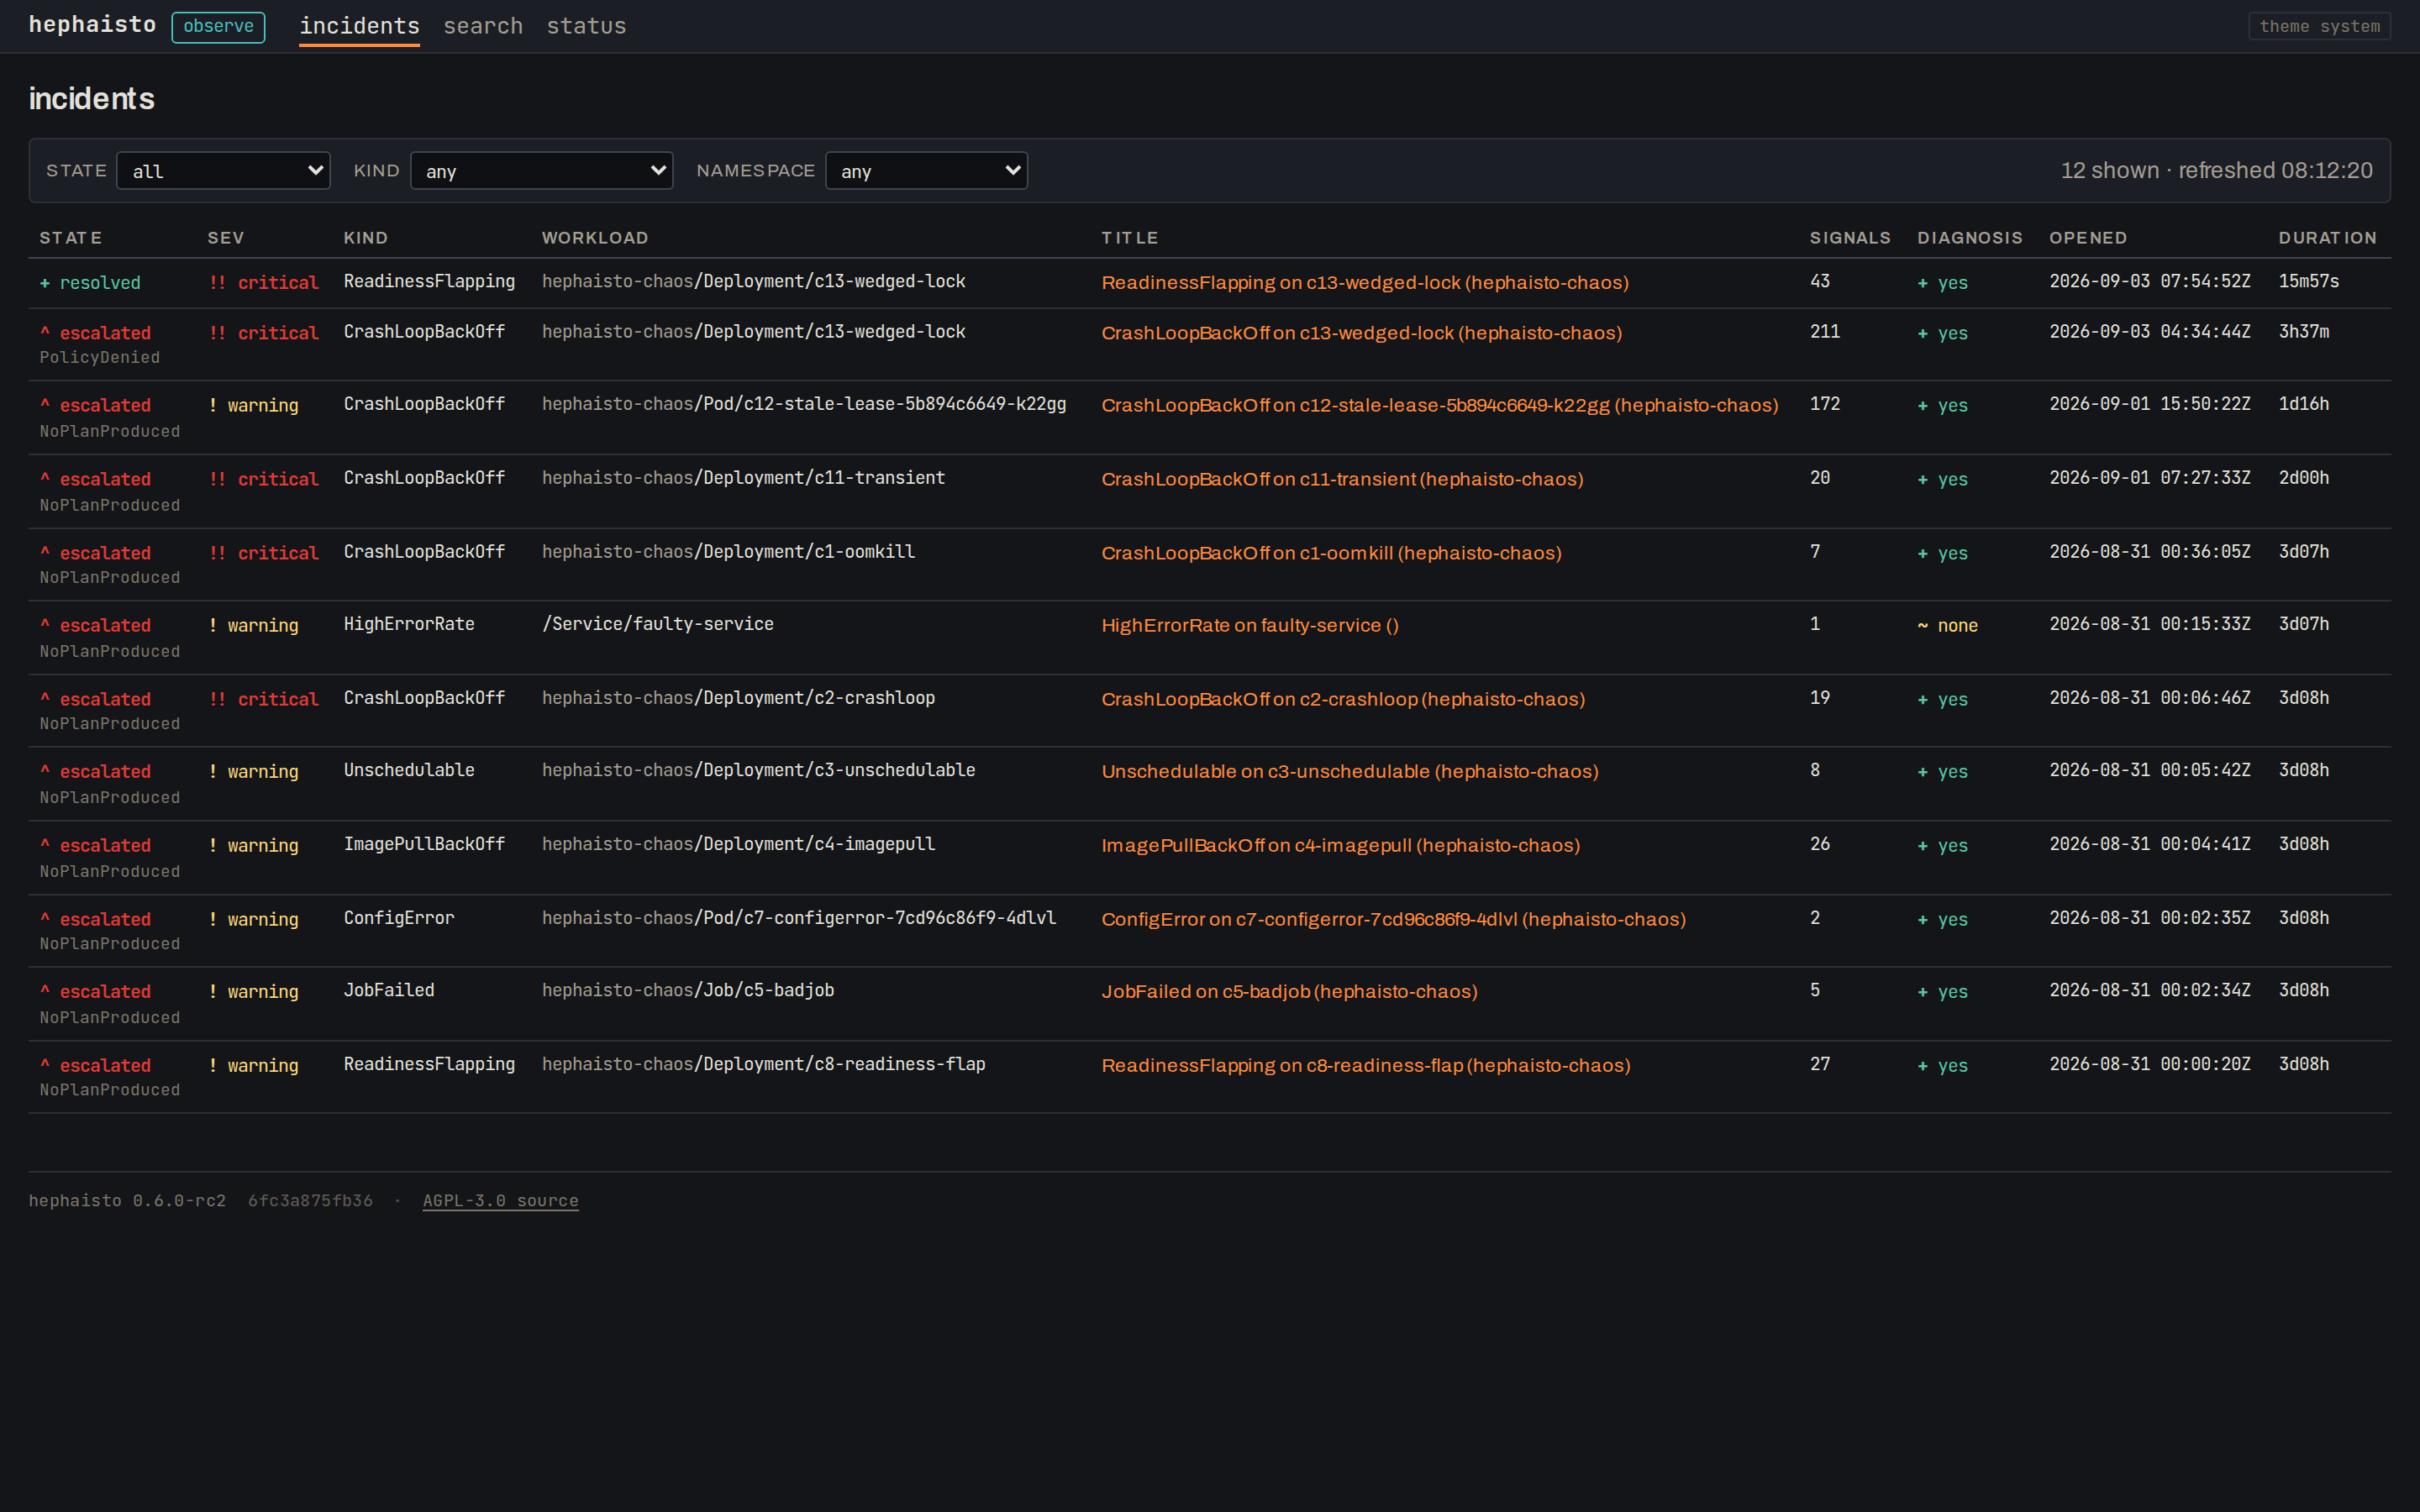
Read all twelve in your browser — no install, no account. Or run the real console locally: two containers, no API key, no Kubernetes, loaded with the same twelve investigations the agent ran against a cluster full of seeded faults — the step trace, the diagnosis, and every citation linking back to the raw tool output it came from.
# then open http://localhost:8080
curl -fsSL https://raw.githubusercontent.com/TrueRelevance/hephaisto/main/demo/compose.yaml \
  | docker compose -f - up
Ten of them were replayed from recorded tool traces, and nine of those ten were graded
correct against a written answer key. The tenth is in there too, labelled — a demo showing
only what worked would be a different claim. Those ten are the output of a replay, not an
agent running: connected to nothing, it detects nothing and refuses every action.
The other two are live captures, exported from the agent's own database
after a real run on a real cluster — one where it restarted a wedged pod and the incident
reached Resolved, and one where it diagnosed the same fault, proposed the same
fix, and policy refused it.